While RUM (Real User Monitoring) continues to be GoDaddy’s primary performance metric, synthetic measurements fill a critical role as well. On my team, we use Google Lighthouse to provide a consistent set of synthetic benchmarks across Performance, SEO, and more.
But what is Google Lighthouse? From their own words:
Lighthouse is an open-source, automated tool for improving the quality of web pages. You can run it against any web page, public or requiring authentication. It has audits for performance, accessibility, progressive web apps, and more.
Imagine that you need to know how changes in your application are going to perform before you roll them out to customers. Now imagine that you need to automate that monitoring and rollout process. To solve that problem, we built Lighthouse4u (LH4u), an open source package that allows you to leverage Google Lighthouse via an API call. In this article I’ll introduce Lighthouse4u in more detail and show how you can use it in your pipeline to build on the benefits offered by Google Lighthouse
curl -H "Content-Type: application/json"
  -X POST -d '{ "url": "http://localhost:1337", "wait": 30000 }'
  https://my-lh4u-app/api/website > ./LH-results.json
What is Lighthouse4u?
In short:
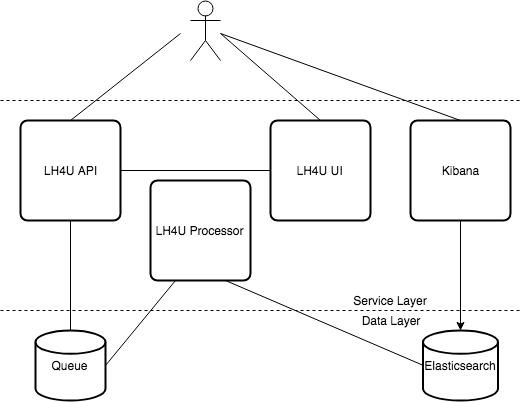
LH4U provides Google Lighthouse as a service, surfaced by both a friendly UI+API, and backed by Elasticsearch for all your query and visualization needs.

When my team wanted to adopt Google Lighthouse as part of our pipeline, we realized we’d need to instrument it into dozens of applications which would be a time-intensive foray, one fraught with duplicated work, bugs, and inconsistencies. It’s important to remember Lighthouse is an incredibly CPU intensive tool, specifically a benchmark, and if the underlying hardware is not both consistent and isolated from other (CPU and IO) tasks, the value of your results may greatly diminish.
Use Cases
In addition to enabling easier integration with Lighthouse across multiple applications,LH4U builds upon Lighthouse by providing unique opportunities:
- Parallelism - As the saying goes, time is money. If you have several tests you need to run, you should wait the duration of the slowest test, not the sum of all tests. In some cases we run Lighthouse tests over 100 times faster using LH4U than if we had run Lighthouse directly in our pipelines.
- Pre-Checks - RUM by nature requires measuring real users. To catch performance regressions before they go out, we need reliable synthetic benchmarks.
- Baseline - Unlike RUM, Lighthouse4U provides a consistent benchmark from which to compare a time series of results without bias towards time of day, geography, networking, and the other myriad of influencing real world factors.
- Advanced Cases - Being we test against a diverse set of websites ranging from products to customer-built websites we have need for features such as validation, samples, attempts, and delays.
- History - Your entire test history can be searched via Elasticsearch, and visualized via Kibana.
Let’s drill into some of these use cases.
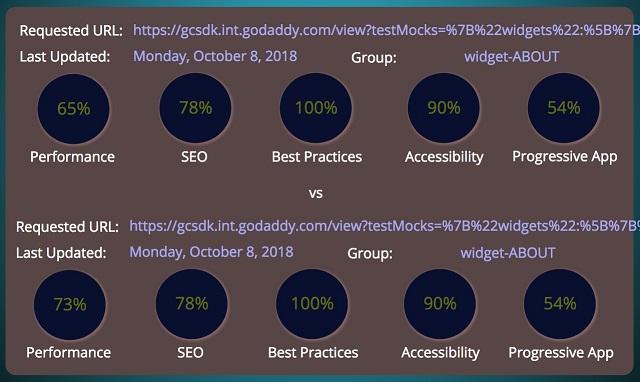
Simple Visualization
Imagine that you wanted to visually compare the performance of a change from the comfort of your existing Github Pull Request (or similar tool). LH4U has you covered by way of SVG cards surfaced directly in your Markdown or HTML.


Advanced Visualization
One of the big benefits of leveraging Elasticsearch as our storage engine is that we can leverage Kibana (which sits atop Elasticsearch) for all our visualization needs. Being able to visualize based on grouping of results, time ranges, domains, scores and more is a powerful utility.
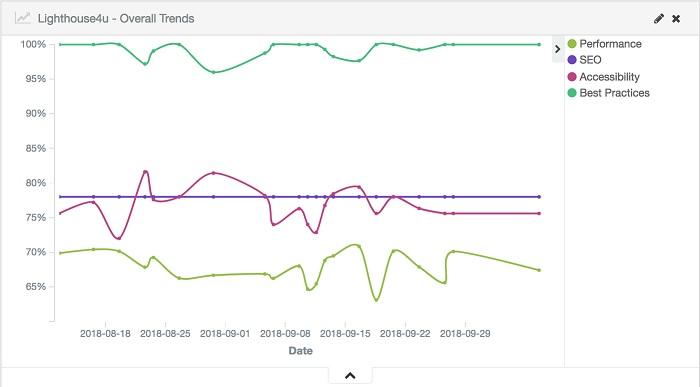
Performance Trends
Here we find our Kibana dashboard showing us how our website is performing over time to learn from the changes we’re making.

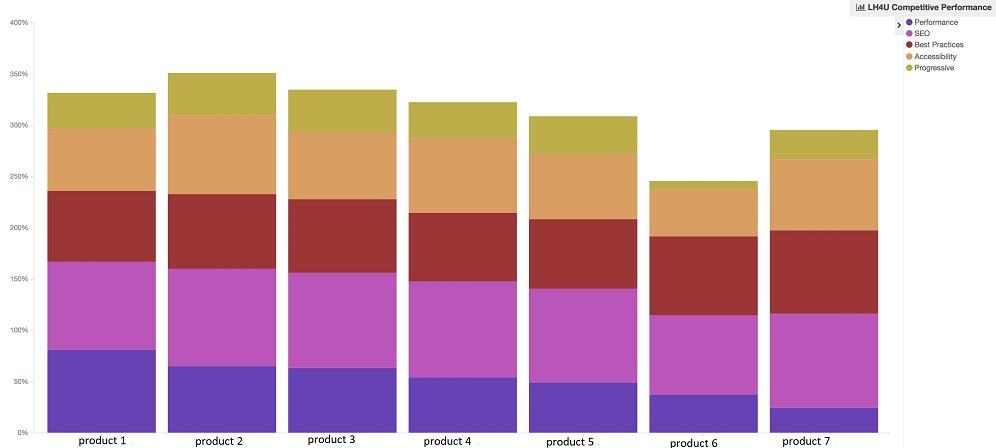
Competition
Yep we even compare (favorably) against competition! Names redacted, but we’re on the high end in case you’re curious.

Getting Started
LH4U has two requirements, Elasticsearch and an AMQP-compatible Queue (we use RabbitMQ). Both requirements are opensource and easy to setup if you’re not already using them.

npm i -g lighthouse4u
lh4u --config-dir ./app/config
  --config-base defaults
  --config local
  -- init
In the above example all configuration data is in ./app/config folder, defaults are in file ./app/config/defaults[.json|.js|.json5] (extension is auto-detected to support CommonJS, JSON, and JSON5 formats), merge in my environment config file ./app/config/local[.json|.js|.json5], and to run the init (Initialize) command. After you run this one-time operation to create your LH4U Elasticsearch index & AMQP queue, you can run the server command to spin up the HTTP Server.
Options
A myriad of options are available, but here is a summary of the more interesting bits:
http.auth- Adds the ability to restrict UI & API to whitelisted groups.basicauth is available out-of-the-box, but feel free to supply your owncustomprovider viacustomPath. We use this for JWT internally.http.routes- Allows you to extend your LH4U instance with your own custom routes. This can be handy if you need to extend the behavior of your server.lighthouse.config- All LH settings can be overridden to fit your needs.lighthouse.validate- A handy feature in cases where you need to verify that the responding page is who and what you think before you record the LH results of an incorrect page. Useful in cases where there may be DNS transitions. Plug in your own validation logic and the explicit group(s) will get properly validated.lighthouse.samples- Tunable range of LH samples for every request, storing the best performing result. Helpful to weed out most variances.lighthouse.attempts- Tunable number of attempts before the service will give up trying to record LH results. Helpful for race condition situations.lighthouse.delay- Helpful if you know the page you want to test against won’t be available for a period of time.
Dynamic Pipelines
We’ve got a ton of useful data, but what can we do with it automagically? In the case of a CICD pipeline, instead of surfacing the results, nothing prevents you from comparing your PR with your Master results and blocking the build if performance (or another metric) degrades.
Example pipeline:
# submit
curl -u "myUser:superSecret" -H "Content-Type: application/json"
  -X POST -d '{ "url": "url1", "wait": 30000 }'
  https://my-lh4u-app/api/website > ./url1-result.json
curl -u "myUser:superSecret" -H "Content-Type: application/json"
  -X POST -d '{ "url": "url2", "wait": 30000 }'
  https://my-lh4u-app/api/website > ./url2-result.json
# compare
# bail if you don't like the delta between results
The default behavior of a POST is to return once queued, but the above example uses the wait feature. Handy for scripting operations to avoid having to do hacky polling.
Final Thoughts
We try to share any technology that we’ve found valuable and despite its young age, LH4U has proven to be a great tool. We hope others can find it useful as well. Please contribute!
Attribution
Thanks to Chad Sparkes for the cover image.


